
TL;DR
- The revenue per employee benchmark exposes whether your scale is creating leverage or just growing payroll.
- Most scaling CEOs cannot tell you where they stand against this number today, let alone whether it is moving in the right direction.
- Headcount decisions made without an efficiency baseline cost you margin and speed, and the damage compounds before it shows up in your financials.
- The Efficiency Audit Framework gives you four numbers that surface the drag before it becomes a crisis.
- If you cannot recite your revenue per employee benchmark right now, your strategy is running on assumptions.
You are scaling. Revenue is moving. Headcount is growing. Somewhere in the middle of that momentum, you stopped tracking the numbers that tell you whether the machine is actually getting more efficient or just more expensive. The revenue per employee benchmark is one of them.
That is not a reporting gap. That is a strategy gap. Business strategy breaks when teams accelerate execution before the operational picture is honest. The metrics that expose whether your growth is real get crowded out by the dashboard you inherited from last year’s growth stage, the one built to measure growth, not efficiency.
By the time the inefficiency shows up in your financials, it has been compounding for months.
What Metrics Do Scaling CEOs Stop Tracking?
The metrics that predict whether your trajectory holds or quietly buckles do not appear on the standard dashboard. Revenue, headcount cost, and customer count are lagging indicators. They tell you what already happened. They do not tell you whether the decisions you are making right now are building efficiency or eroding it.
The leading indicators are: revenue per employee benchmark, decision latency, throughput-to-headcount ratio, and pipeline-to-capacity alignment. They move before your financials do. When you ignore them, you are not flying blind all at once. You are flying blind one quarter at a time, and the picture only gets clear after the damage is done.
These metrics get dropped for a predictable reason. At scale, the dashboard gets crowded. The metrics that feel strategic, revenue, pipeline coverage, burn rate, take up the space. The efficiency metrics get delegated or dropped. No one announces they stopped tracking them. They just stop showing up in reviews. And because revenue keeps moving, there is no obvious signal that anything is wrong. The company feels like it is working. What it is doing is getting heavier.
Why Strategy Breaks Without Operational Metrics
This is where pivoting goes sideways. Most pivots are not failed product decisions. They are failed operational reads dressed up as strategic ones.
The assumptions embedded in your growth plan are not validated because you stopped tracking the metrics that would confirm or contradict them. You are assuming your team is at full throughput. You are assuming your processes are tight. You are assuming capacity scales linearly with headcount. None of those assumptions have been tested against numbers that would expose them.
Strategy built on unexamined assumptions is not strategy. It is optimism with a slide deck.
The pressure to scale fast creates a specific blind spot. Your board watches revenue, pipeline, and headcount. But headcount growth and operational leverage are not the same thing, and most founders treat them as if they are. Adding people feels like investment. In many cases it is. In many cases it is also a substitute for making harder decisions about structure, process, and role clarity.
Every hire that lands in an undefined role, every manager who is managing tasks instead of outcomes, every team adding headcount before the existing system is optimized: these are efficiency leaks. They do not show up in your revenue line today. They show up in your margin six months from now and in your organizational drag twelve months from now.
What Is the Revenue Per Employee Benchmark?
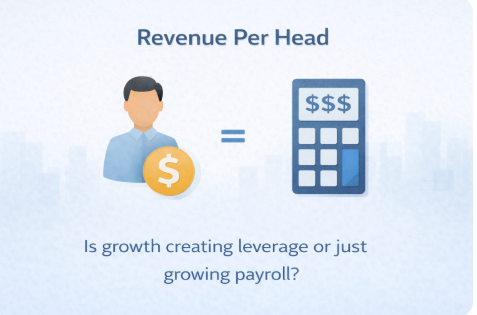
Revenue per employee is total revenue divided by total full-time headcount. It is the cleanest proxy for whether your growth is creating operational leverage or just growing payroll.
“High-performing companies benchmark revenue per employee at $300,000 to $500,000 as a core indicator of operational health.”
Maxio, “The Most Important SaaS Metrics,” September 2025
Most scaling founders cannot tell you where they stand against the revenue per employee benchmark today, let alone whether it is trending in the right direction.
If revenue is growing at 30% and headcount is growing at 45%, you are not scaling efficiently. You are adding cost faster than leverage. That gap is a decision. Most founders are not making it consciously because they are not tracking the number that surfaces it.
Revenue per employee benchmark declining means cost is outpacing output. Flat while revenue grows means you are holding efficiency. Rising means the systems are working. You need a current number, a trend line, and an industry benchmark to make this metric actionable.
The Efficiency Audit Framework: Four Numbers That Surface the Drag
Run this quarterly. Own the output. Do not delegate the diagnosis.
- Revenue Per Employee Benchmark. Total revenue divided by total full-time headcount. Your baseline efficiency number. Calculate it for the last four quarters. Put the trend in front of your leadership team. If no one in that room can tell you whether the trend is acceptable for your stage and sector, that is the first problem to fix.
- Decision Latency. How long does it take for a decision to move from identification to execution? At scale, latency is a tax. Every day a decision sits in a queue, a meeting, or waiting for approval is a day your competitor moves and you do not. High decision latency is almost always a structural problem, not a people problem, and it compounds as organizations grow. Identify the single highest-latency decision in your organization right now and trace it back to a structural cause.
- Throughput-to-Headcount Ratio. Is your team’s output growing in proportion to your investment in people? Output can be deals closed, products shipped, tickets resolved, or campaigns launched. If output is flat and headcount is growing, you have an efficiency problem masquerading as a capacity problem. Adding more people will not fix it. Fixing the system will. Run a throughput audit on your highest-cost team and compare output this quarter to output twelve months ago, normalized for headcount.
- Pipeline-to-Capacity Alignment. Can your current operational capacity actually support the revenue you are projecting? Most scaling companies have a pipeline that assumes a level of throughput their operations cannot deliver at current headcount and process maturity. That gap is where deals slip, delivery falters, and customer experience deteriorates, not because your people are failing, but because the system was never sized for what the forecast demands.
What a Scaling CEO Does Differently With This Data
A scaling CEO who runs this framework does not use it to cut headcount. They use it to make better decisions before headcount becomes the problem.
They know their revenue per employee benchmark before their CFO does. They can tell you whether decision latency is increasing or decreasing this quarter. They have a throughput number that is not anecdotal. They have run a pipeline-to-capacity analysis before committing to a growth target.
That connection between strategy and operational reality is what allows pivots to be intentions instead of emergencies. It is what allows growth to be deliberate instead of reactive. And it is what allows the organization to move faster as it gets bigger instead of slower.
The CEO who builds this cadence is not running a tighter ship for the sake of discipline. They are running a company where every strategic decision is grounded in an honest operational read. That is what separates companies that scale with margin from companies that scale with fragile momentum.
CEO-Actionable Decisions
- Pull your revenue per employee benchmark this week. Calculate it for the last four quarters and put the trend in front of your leadership team. If no one in that room can tell you whether the number is acceptable for your stage and sector, that is the first problem to fix.
- Identify the single highest-latency decision in your organization. Trace it back to a structural cause, not a people problem.
- Run a throughput audit on your highest-cost team. Compare output this quarter to output twelve months ago, normalized for headcount. If throughput has not grown proportionally, the system needs work before the team does.
- Close the gap between your pipeline and your actual delivery capacity before you commit to your next growth target.
The revenue per employee benchmark will not surface itself. You have to build the cadence that pulls it into the room.
Every scaling company reaches a point where the strategy is sound, the market is willing, and the organization is not ready. These four numbers are the early warning system for that gap. If you are not reading those signals now, you will not see the problem until it is already expensive. That is not a systems failure. That is a leadership choice.